
Figure 2.
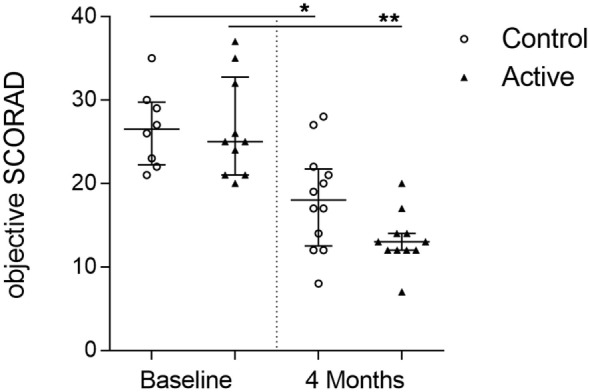
Reduction of atopic dermatitis severity over time. Individual oSCORAD of the control (open dots) and active (closed triangles) groups at baseline and after 4 months of dietary intervention, for infants from which serum samples were available (n = 41). Line represents median ± interquartile range. Significant differences within the groups are depicted with asterisks (non-paired W-test, *p < 0.05, **p < 0.01).