Figure 5.
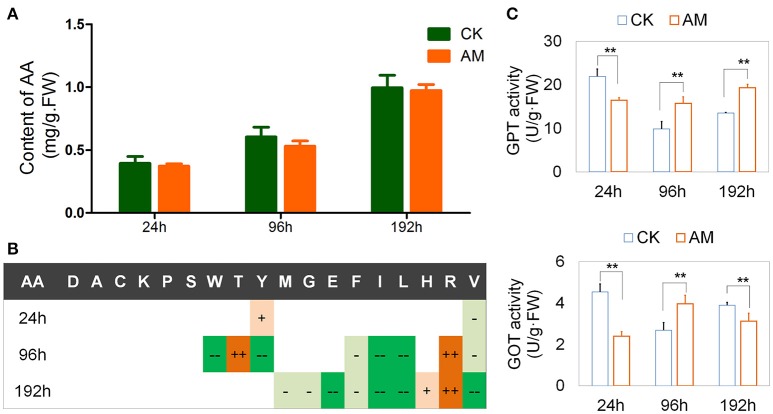
Effects of hyperproteinemia on free amino acid contents and enzymatic activities. Bombyx mori larvae were treated as described in the Figure 1. Each FB sample was a mixture obtained from 10 individuals and was used for the amino acid determination (sample weight 0.50 g) and the biochemical assays (sample weight 0.10 g). At each time-point, three samples were measured in each group. (A) Total contents of free amino acids in the fat body and (B) significant statistical differences between the animal model (AM) of hyperproteinemia and the control group without treatment (CK). (C) Activity of glutamic-pyruvic transaminase (GPT) and glutamic oxaloacetic transaminase (GOT) 24, 96, and 192 h after hyperproteinemia was induced. In (B), + and − symbols indicate that the contents of free amino acids in the AM group were higher and lower, respectively, than those in the control group. Single + or − symbols indicate P < 0.05, and two ++ or −− symbols indicate P < 0.01 (n = 3). In (C), ** indicates P < 0.01 (n = 3). The absolute values about (B) was shown in Table S2.

