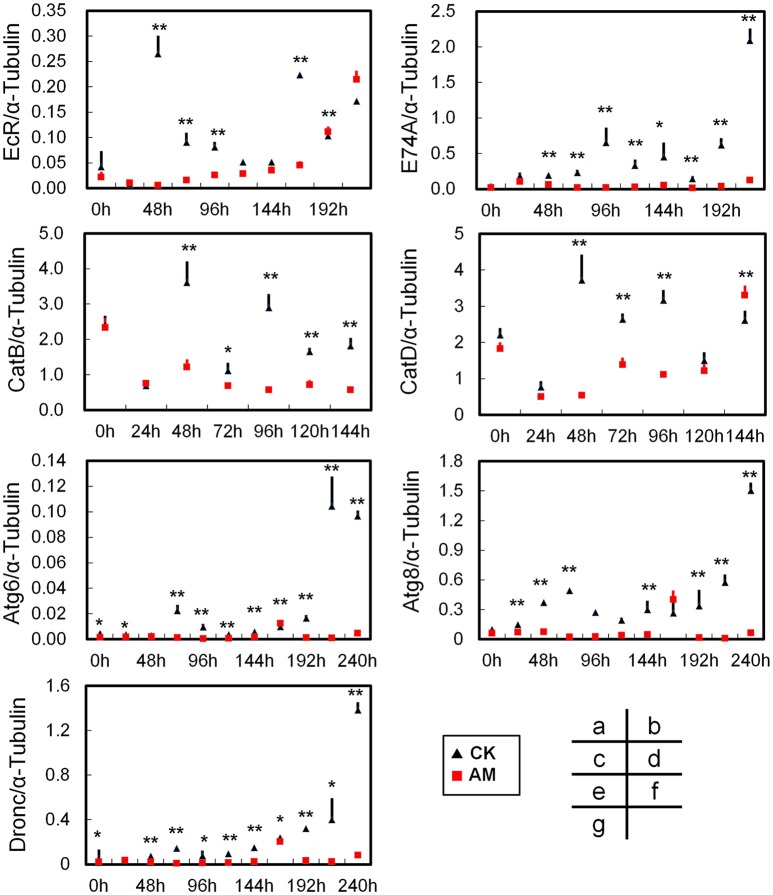
Figure 6.
Quantitative real-time reverse transcription–PCR analysis of the relative transcript levels of the BmEcR (A), BmE74A (B), BmCatB (C), BmCatD (D), BmAtg6 (E), BmAtg8 (F), and BmDronc (G) genes in the FB during metamorphosis. Total RNA was isolated from each FB sample, which was a mixture from three individual silkworms at 24, 48, 72, and 96 h after hyperproteinemia was induced. Transcript levels of the B. mori α-tubulin gene were used as an internal reference. CK, the control group; AM, animal model of hyperproteinemia. The abscissa indicates the time points after the remodeling process, namely the time after the remodeling treatment. * and ** indicate significant differences between the two groups at P < 0.05 and P < 0.01, respectively (3 samples were measured in each group, n = 3).

