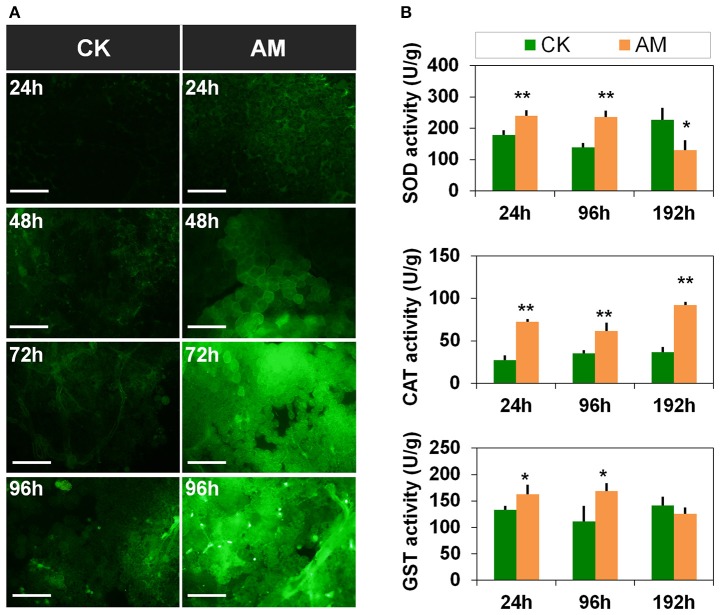
Figure 8.
Changes in the oxidative stress level of the fat body (FB) during metamorphosis. Bombyx mori larvae were treated and sampled as described in the Figure 1. (A) Reactive oxygen species (ROS) staining of the FB. (B) Activities of super oxide dismutase (SOD), catalase (CAT), and glutathione S-transferase (GST) at 24, 48, 72, and 96 h after the induction of hyperproteinemia. Each FB sample, which consisted of a mixture from 10 silkworms, was obtained in triplicate and used for repeat measurement of SOD, CAT, and GST activity levels. * and ** indicate significant differences between the two groups at P < 0.05 and P < 0.01, respectively (n = 3). The bar = 50 μm.

