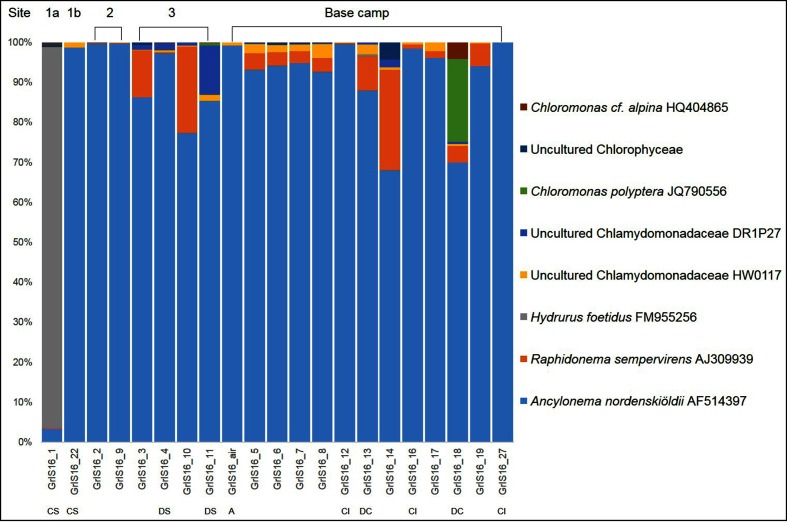
Fig. 2.
Algal community composition on the GrIS, with the eight most abundant taxa comprising >99 % of the total community at each sampling location. Full details can be found in Tables S3 and S4. The data presented here are based on the clustering of OTUs at 99 % similarity. The community composition based on the oligotyping approach can be found in Fig. 3. Locations are indicated above the histogram while sample types are shown below: CS, clean snow; DS, dirty snow; A, air; CI, clean ice; DC, dispersed cryoconite; all others represent dirty ice samples.

