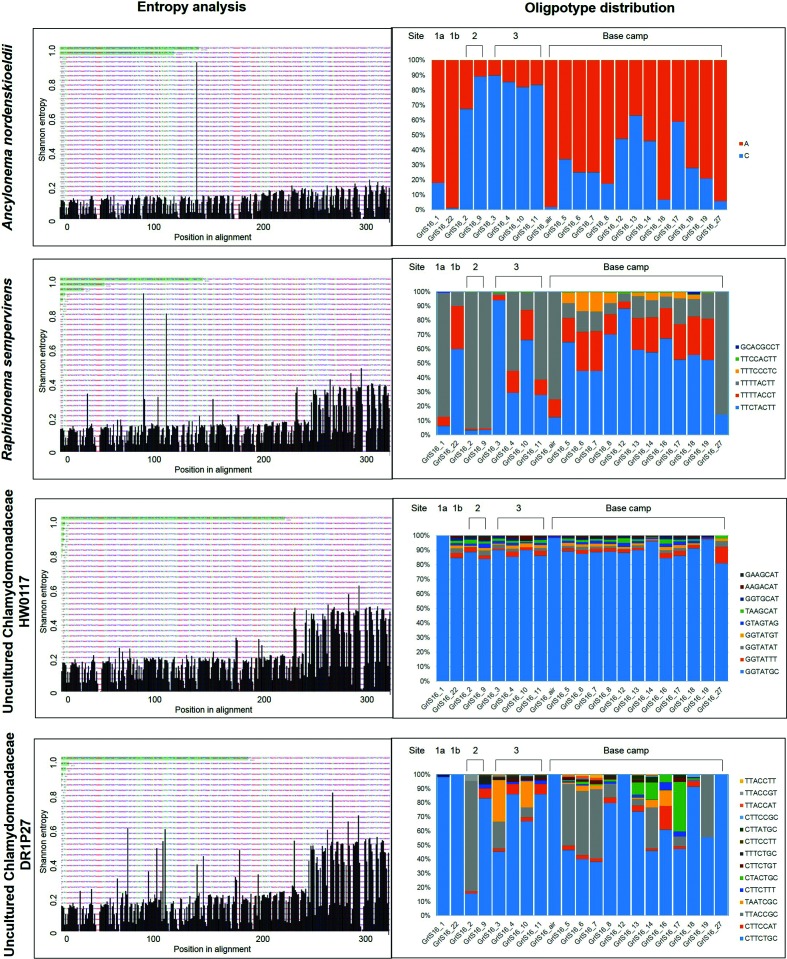
Fig. 3.
Graphs on the left show the most information-rich nucleotide position for the individual taxa, as revealed by the Shannon entropy analyses. Positions in the sequence alignment are on the x-axis, and the volume of Shannon entropy is on the y-axis. The entropy of each column in the nucleotide alignment was quantified [on a scale from 0 (none) to 1 (highest entropy)], and nucleotide positions with the highest entropy values were used for the oligotyping process. All the entropy peaks below ~0.2 can be regarded as sequencing noise and are likely not due to biological variation. The results of the Shannon entropy analyses were then used to derive distinct oligotypes, of which the distribution is displayed in the graphs on the right. The full details of the oligotype relative abundances can be found in Tables S5–S9. Oligotype names are derived from the nucleotide variations in the sequence alignment (Fig. S1).

