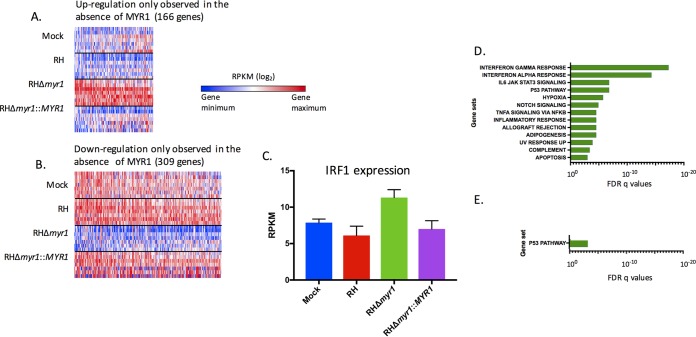
FIG 4 .
Parasite-induced gene expression changes that are masked in a MYR1-dependent manner. (A) Heat map of the 166 genes that exhibit a statistically significant higher expression of ≥1.5-fold between RHΔmyr1 and RH-WT-infected cells, but not between mock- and RH-WT-infected cells. (B) As for panel A, except the heat map shows the 309 genes that exhibit a statistically significant lower expression of ≥1.5-fold change between RHΔmyr1- and RH-WT-infected cells, but not between RH-WT- and mock-infected cells. (C) Average RPKM values for the IRF1 gene in the different infections. (D) GSEA on the genes from panel A. (E) GSEA on the genes from panel B. Complete lists of the genes contributing to the GSEAs shown in Fig. 4A and B are given in Table S8. All other details for panels D and E are as in Fig. 3C.

