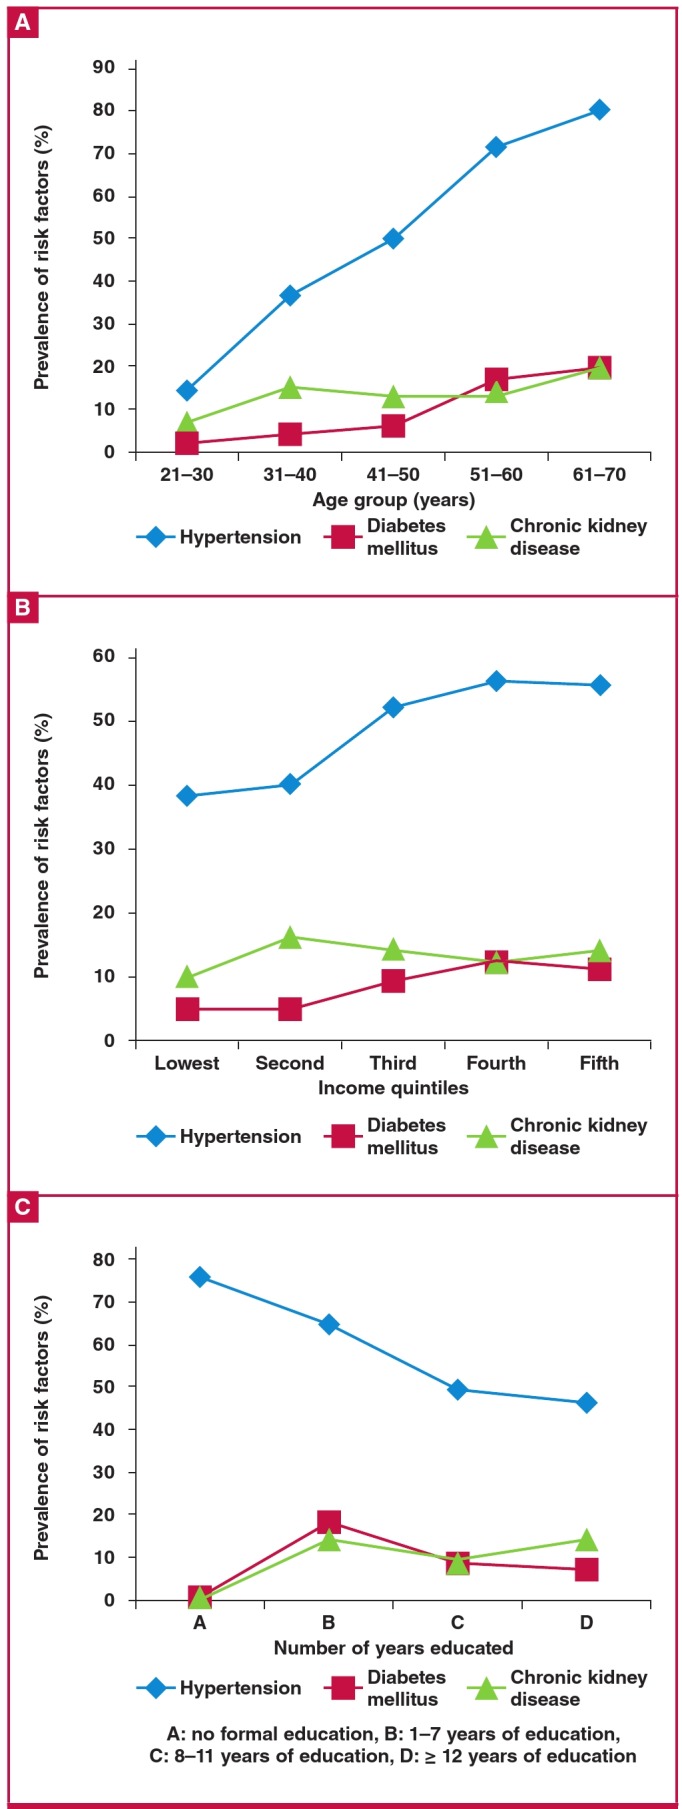
Fig. 2.

Prevalence of non-communicable diseases in relation to some sociodemographic characteristics among 883 staff members of the University of Jos.

Prevalence of non-communicable diseases in relation to some sociodemographic characteristics among 883 staff members of the University of Jos.