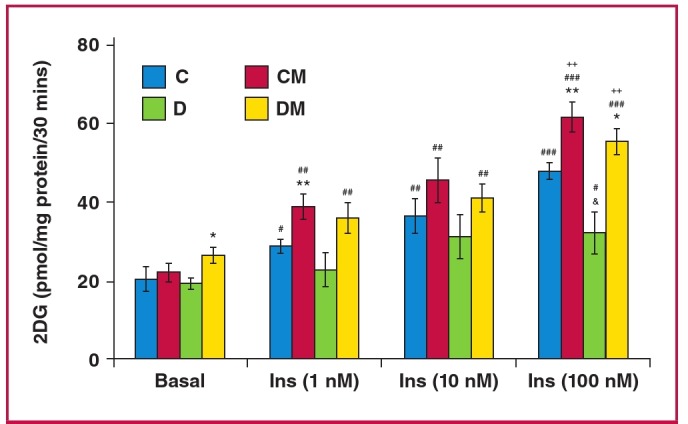
Fig. 4.

Effect of in vivo melatonin treatment (for the last six weeks of feeding) on insulin-stimulated glucose uptake by cardiomyocytes isolated from rats fed a high-calorie diet (20 weeks). Cardiomyocytes were isolated and stimulated with increasing concentrations of insulin for a period of 30 minutes. The accumulated radiolabelled 2DG was measured and expressed as pmol/mg protein/ 30 min. Ins: insulin, C: control, CM: control with melatonin, D: high-calorie diet (dietinduced obesity), DM: diet with melatonin. Treated vs untreated (same dose of insulin or basal): *p < 0.05 (DM vs D), **p < 0.01 (CM vs C). Different doses of insulin vs basal (same group of treatment): #p < 0.05 vs basal, ##p < 0.01 vs basal, ###p < 0.001 vs basal. C vs D (same dose of insulin): and p < 0.05 (D vs C). Comparison between different doses of insulin (same group of treatment): ++p < 0.01 vs 1 nM Ins, n = four to six individual preparations/group; analysed in duplicate.
