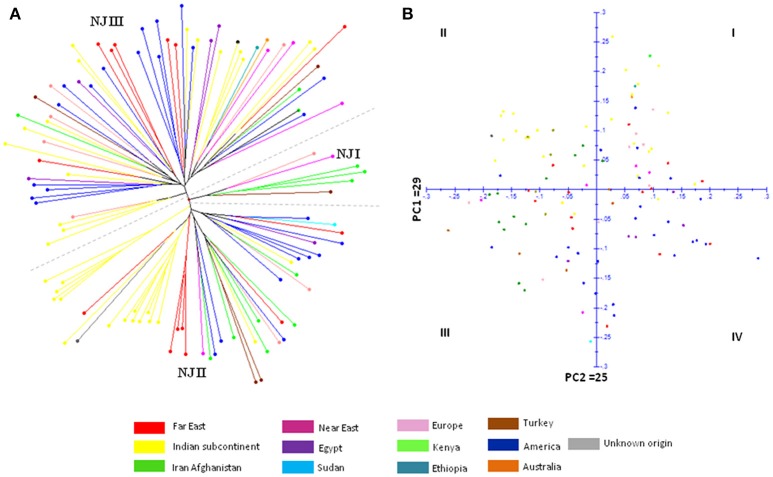
Figure 1.
(A) Neighbor Joining dendrogram elucidating the genetic relationships between 124 CartAP accessions using 93 SSR loci based on simple matching coefficient. NJ clusters (NJ I–NJ III) are demarcated through dashed lines. (B) Scatter plot for Principal Coordinate Analysis (PCoA) exhibiting the distribution of CartAP accessions on two main axes. Primary axes 1 and 2 captured 29 and 25% of the total variance, respectively. Color codes used for different regional pools are provided.

