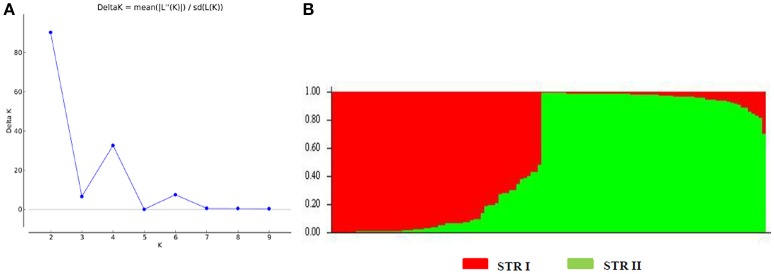
Figure 2.
Population structure of CartAP collection inferred using Bayesian-based program STRUCTURE. (A) Estimation of hypothetical sub-populations using ΔK-values. The number of identified sub-populations were two (K = 2). (B) Population structure analysis of CartAP accessions at K = 2 based on inferred ancestry (Q matrix). The sub-populations were named STR I and STR II.

