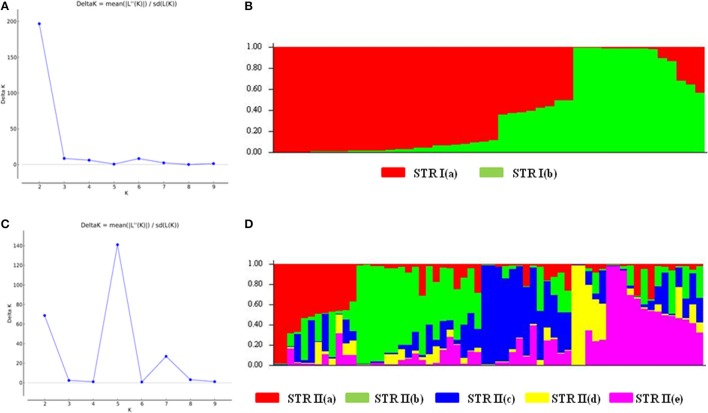
Figure 3.
Hierarchical population structure analysis (A) Estimation of sub-population for STR I. Maximum number of sub-populations were inferred at K = 2. (B) Population structure for STR I at K = 2 based on Q matrix. The sub-populations were designated as STR I(a) and STR I(b) (C) Estimation of sub-populations for STR II. Maximum number of subpopulations were inferred at K = 5. (D) Population structure for STR II at K = 5 based on Q matrix. The sub-populations were named as STR II(a)–STR II(e). Color codes for each sub-population are provided.

