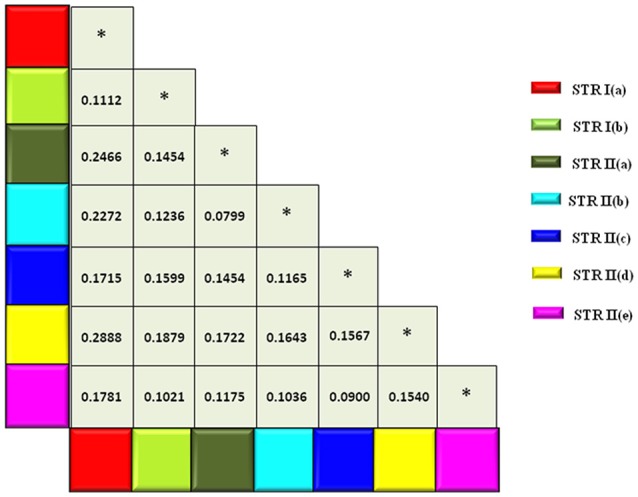
Figure 4.

Matrix showing pairwise FST-values between sub-populations inferred through hierarchical STRUCTURE analysis. Color codes are provided for each sub-population. *Denotes FST-values between same sub-population.

Matrix showing pairwise FST-values between sub-populations inferred through hierarchical STRUCTURE analysis. Color codes are provided for each sub-population. *Denotes FST-values between same sub-population.