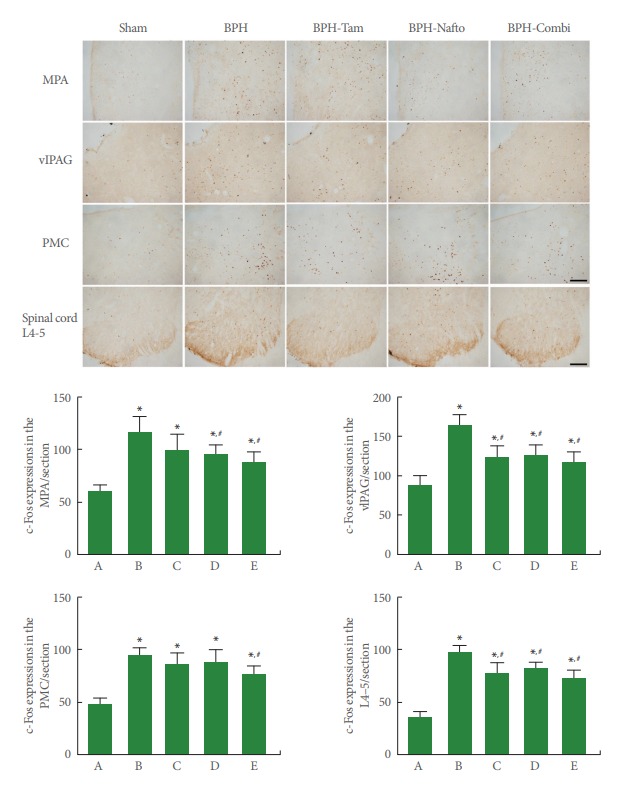
Fig. 2.

c-Fos expressions in the neuronal voiding centers. Upper panel: photomicrographs of c-Fos-stained cells in neuronal voiding centers. The scale bar represents 150 µm (MPA, medial preoptic area; vlPAG, ventrolateral periaqueductal gray; PMC, pontine micturition center) and 200 µm (Spinal cord L4–5). Sham, sham-operation group; BPH, benign prostatic hyperplasia; BPH-Tam, BPH-induced and tamsulosin-treated group; BPH-Nafto, BPH-induced and naftopidil-treated group; BPH-Combi, BPH-induced and combination-treated group. Lower panel: number of c-Fos-stained cells in each group. A, sham-operation group; B, benign prostatic hyperplasia (BPH)-induced group; C, BPH-induced and tamsulosin-treated group; D, BPH-induced and naftopidil-treated group; E, BPH-induced and combination-treated group. *P<0.05 compared to the sham-operation group. #P<0.05 compared to the BPH-induced group.
