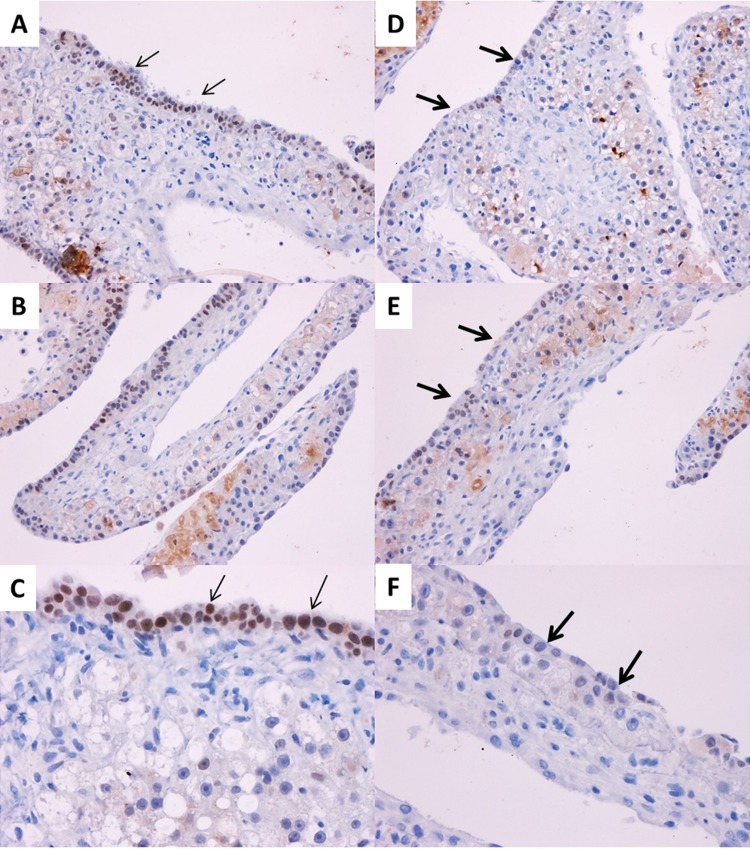
Figure 6.
Appearance of biliary cells from hepatocytes following Oct4 inhibition. Representative photomicrographs of biliary-specific marker HNF-1β following Oct4 inhibition in organoid culture tissue samples on day 21. (A–C) Treated with AD-Scr. (D–F) Treated with AD-Oct4. Thin arrows indicate HNF-1β+ biliary cells. Thick arrows indicate lack of HNF-1β+ biliary cells. Original magnification: 200× (A, B, D, and E) and 400× (C, F).

