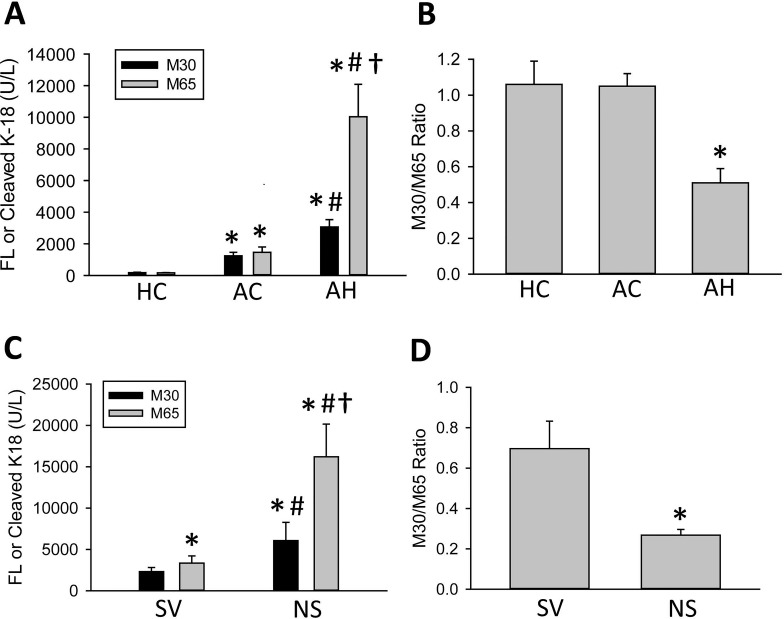
Figure 1.
M30 and M65 measurements in representative patient populations. (A) M30 and M65 were measured in healthy controls (HC) and in patients with alcoholic cirrhosis (AC) and alcoholic hepatitis (AH). (B) The M30/M65 ratios were calculated for these patients. (C, D) AH patients were split by 30-day survival, and the M30 and M65 values and the M30/M65 ratios were recalculated for surviving (SV) and nonsurviving (NS) patients. All data represent mean ± SE. (A, B) *p < 0.05 versus HC, #p < 0.05 versus matched AC, †p < 0.05 versus all other values. (C) *p < 0.05 versus SV M30, #p < 0.05 versus matched SV M65, †p < 0.05 versus NS M30. (D) *p < 0.05 versus SV M30/M65 ratio.

