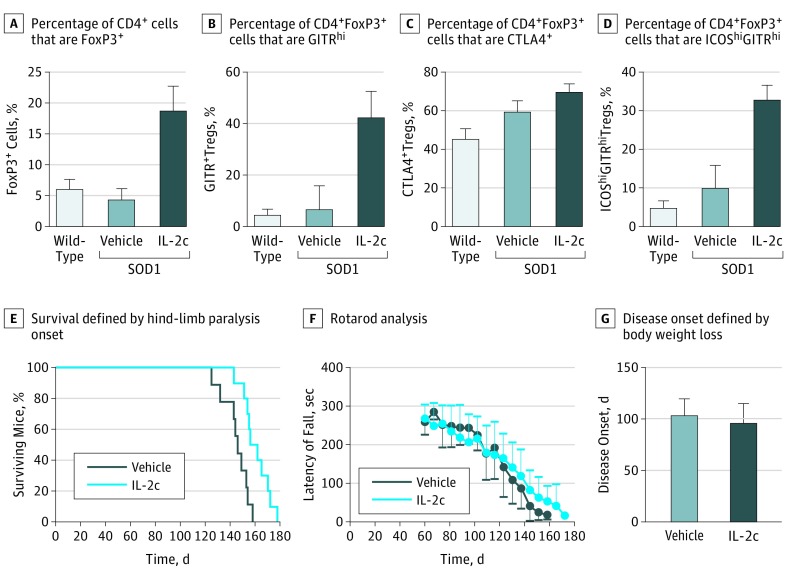
Figure 2. Treatment With Interleukin 2c (IL-2c), Effector Regulatory T-Cell (Treg) Populations, and Disease Progression in SOD1G93A Mice.
A-D, Fluorescence-activated cell sorting analysis of Treg cell populations in peripheral blood isolated from wild-type mice (n = 4), vehicle-treated SOD1G93A mice (n = 5), and IL-2c–treated SOD1G93A mice (n = 5) at 100 days of age. A, Differences were significant between vehicle-treated and IL-2c–treated SOD1G93A mice with respect to the percentage of CD4+ cells that are Foxp3+ (IL-2c–treated mice: mean [SD], 18.9% [3.8%] vs vehicle-treated mice: 4.4% [1.9%]; P < .001) and between IL-2c–treated SOD1G93A mice and age-matched wild-type mice (18.9% [3.8%] vs 6.2% [1.5%]. respectively; P < .001). B, Differences were significant between all groups in the percentage of CD4+Foxp3+ Tregs that are GITRhi (IL-2c–treated mice: 42.6% [9.7%] vs vehicle-treated mice: 6.9% [9.2%]; vs wild-type mice: 4.8% [2.1%]; P < .001). C, In the percentage of CD4+Foxp3+ Tregs that are CTLA4+, differences were significant between IL-2c–treated SOD1G93A mice (69.5% [9.6%]) and wild-type mice (45.0% [11.3%]; P = .03). D, In respect to the percentage of CD4+Foxp3+ Tregs that are ICOShiGITRhi, differences were significant between IL-2c–treated SOD1G93A mice (33.1% [8.0%]), vehicle-treated SOD1G93A mice (9.9% [13.4%]; P = .01), and wild-type mice (5.0% [3.3%]; P = .003).E, Survival of IL-2c–treated SOD1G93A mice (n = 10) was significantly prolonged compared with the vehicle-treated group (n = 9). Survival was defined by onset of hind-limb paralysis. Significance was determined using Kaplan-Meier survival analysis with the log-rank test. F, Rotarod performance. G, Disease onset as determined by the onset of weight loss was not affected by IL-2c treatment.

