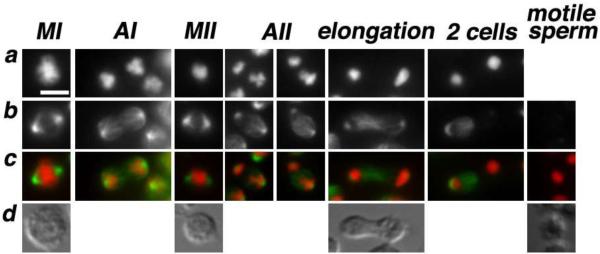
Figure 4. Microtubule dynamics during and following the meiotic divisions.
(a–c) In methanol fixed sperm spreads, DNA was labeled with DAPI (a) and tubulin was labeled with FITC-conjugated anti-α-tubulin monoclonal DM14 (Sigma) (b). In the merge image (c), DNA is red and tubulin is green. Spindles are symmetric during metaphase I & II but become biased towards the X-chromosome side during anaphase II. During the elongation stage, microtubules reposition to the spermatid that has the smaller chromatin mass. (d) DIC images. All images are at the same scale; scale bar = 3 μm.

