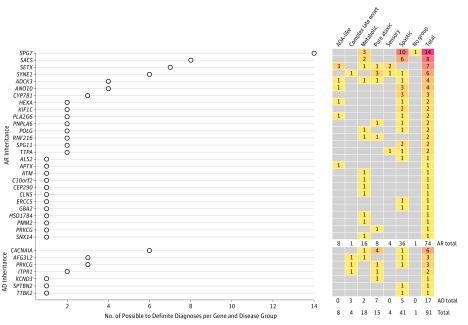
Figure 2. Number of Possible to Definite Diagnoses per Gene and Disease Group.
The left part of the Figure plots the number of patients identified with possible to definite mutations for each gene listed. The right part shows the repartition of these patients among the 6 disease subgroups. Disease groups are described in the Patient Recruitment and Clinical Evaluation subsection of the Methods section. AD indicates autosomal dominant; AR, autosomal recessive; AOA, cerebellar ataxia with oculomotor apraxia.

