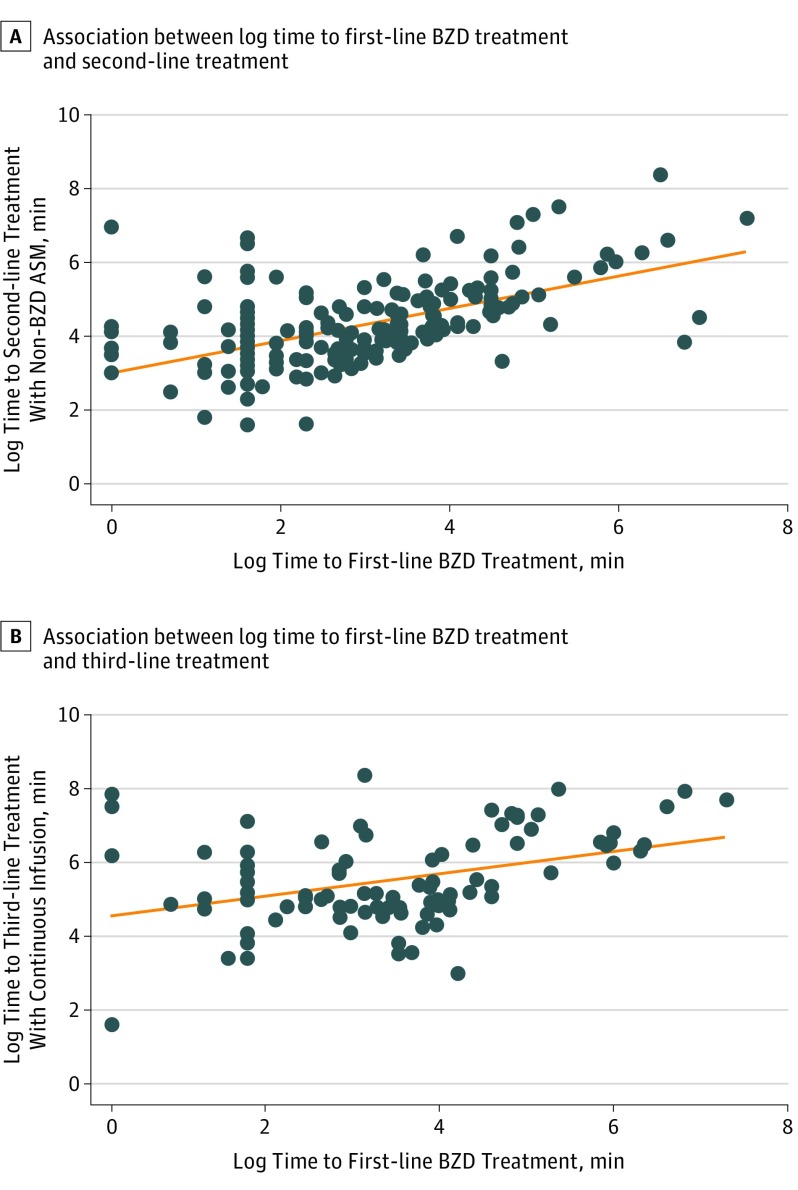
Figure 3. Association Between Log Time to First-line Benzodiazepine (BZD) Treatment and Second- and Third-line Treatments.
A, The x-axis represents the time to the first-line BZD treatment in minutes in a log transformation, and the y-axis represents the time to the second-line treatment with non-BZD antiseizure medication (ASM) in minutes in log transformation. A linear association exists between log time to the first-line BZD treatment and log time to the second-line treatment with non-BZD ASM; with every 1 minute change in a log scale of the first-line BZD treatment, the second-line treatment was administered 0.8 log minutes later (95% CI, 0.64-0.95; P < .001). B, The x-axis represents the time to the first-line BZD treatment in minutes in a log transformation, and the y-axis represents the time to the third-line treatment with continuous infusion in minutes also in log transformation. A linear association exists between log time to the first-line BZD treatment and log time to the third-line treatment; with every log minute change of the first-line BZD treatment, the third-line treatment was administered 0.5 log minutes later (95% CI, 0.25-0.78; P < .001).

