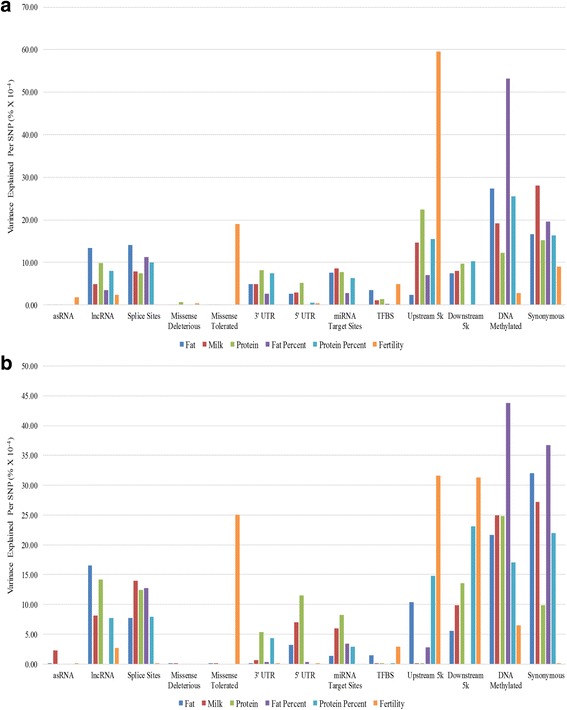
Fig. 7.

The proportion of variance captured by each class for cow and bull records. The x axis represents the functional classes, the y axis representing the proportion of variance captured by each class (as a percentage of the total variance explained in that trait). a Only cow phenotypic records (b) only bull phenotypic records
