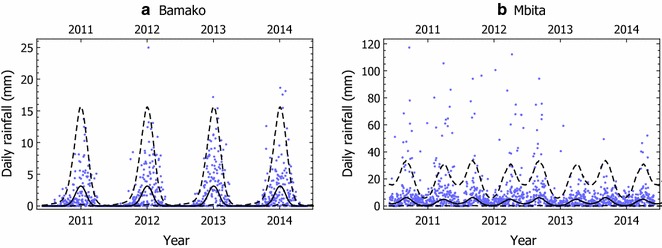
Fig. 1.

Actual rainfall (blue dots) versus quantiles of simulated (black lines) series for Bamako, Mali and Mbita, Kenya. In each panel, the solid line and two dashed lines represent the median, 5%, and 95% quantiles across 500 simulations of the daily rainfall series, which have been smoothed using 30-day moving averages
