
Fig. 3.
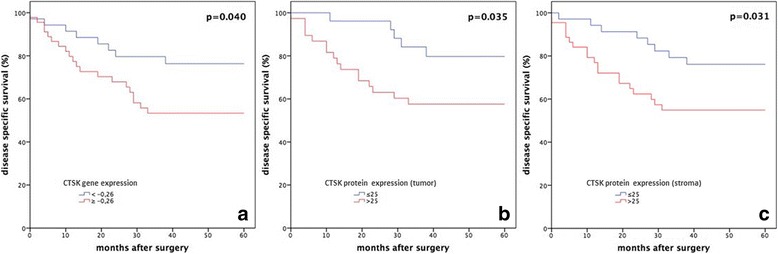
Kaplan Meier disease specific survival (DSS) plots for all patients with OSCC (n = 83). Cases were stratified according to differential expression of CTSK, and were dichotomized into low and high expression according to the determined cut-off point in panel a for gene expression (− 0.26) and in panel b and c for protein expression (25). P-values in a-c represent the Log-rank test of this group comparison and therefore differ from the significance levels of the Cox-regression analysis in Table 4. In all three analyses, high CTSK expression was strongly associated with a worse 5-year DSS