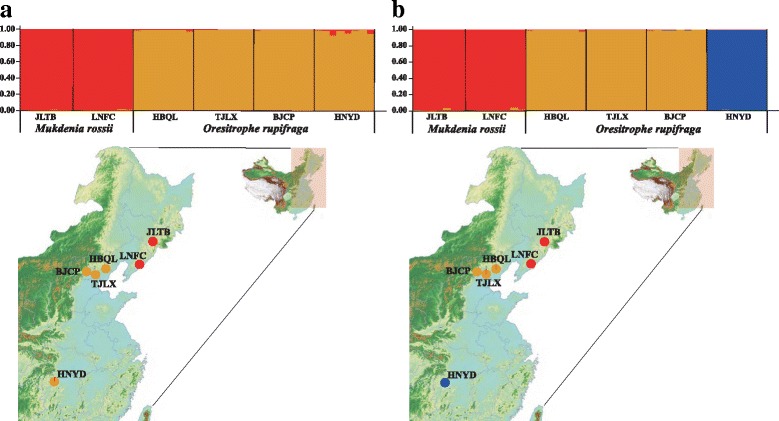
Fig. 8.

The probability of membership and geographical distribution of gene pools in Mukdenia rossii and Oresitrophe rupifraga, detected by STRUCTURE analysis: K = 2 (a) and K = 3 (b). Each vertical bar represents one individual (N = 47), with populations arranged by collection site from Northeast to Central China
