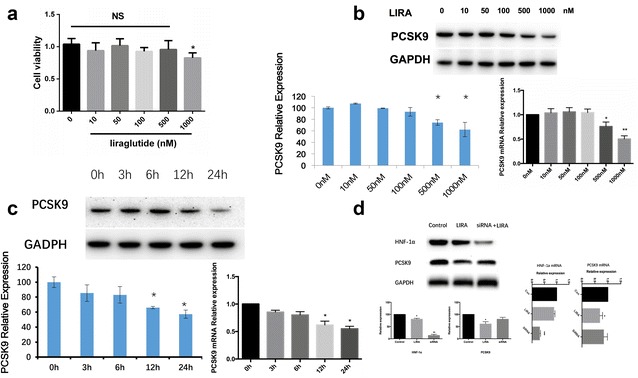
Fig. 1.

The effect of liraglutide on PCSK9 and HNF1α expressions in HepG2 cells. a HepG2 cells were incubated with different concentrations for 24 h and cell viability was determined by CCK-8 assay. b PCSK9 expression with liraglutide treatment in different concentrations (0, 10, 50, 100, 500, 1000 nM) for 24 h. c PCSK9 expression with liraglutide treatment in 500 nM for different times (0, 3, 6, 12, 24 h). d HNF1α expression with liraglutide treatment (500 nM) for 24 h. The normalized intensities of PCSK9 and HNF1α versus GAPDH are shown as mean ± SEM of three independent dose- and time-dependent experiments. *P < 0.05 vs. 0 nM liraglutide treatment (PBS treatment). #P < 0.05. NS not significant, Con control, LIRA liraglutide
