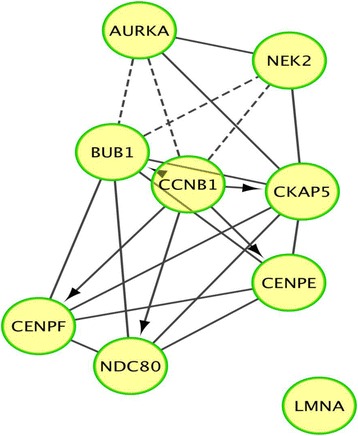
Fig. 3.

Pathway analysis illustrating differential gene expression and association between gene nodes. The gene nodes display gene depletion (q ≤ 0.05) and include the following candidate genes: BUB1, CCNB1, CENPE and CENPF. The arrows with blunt ends denote negative regulation and sets with overlapping content are connected by a line of long dashes. The arrows represent positive regulation
