Fig. 6.

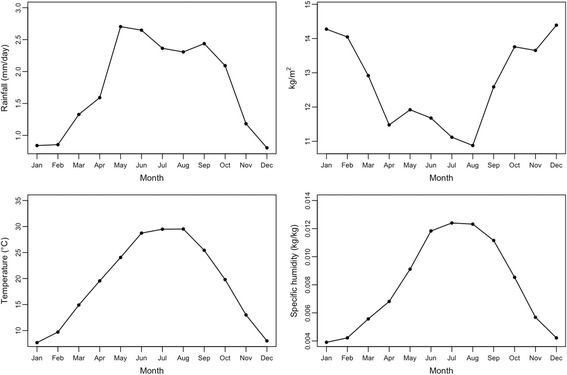
Monthly means of aggregated hydrology and meteorology in west Texas during the study period. Top left pane: rainfall; top right pane: soil moisture; bottom left pane: temperature; bottom right pane: specific humidity

Monthly means of aggregated hydrology and meteorology in west Texas during the study period. Top left pane: rainfall; top right pane: soil moisture; bottom left pane: temperature; bottom right pane: specific humidity