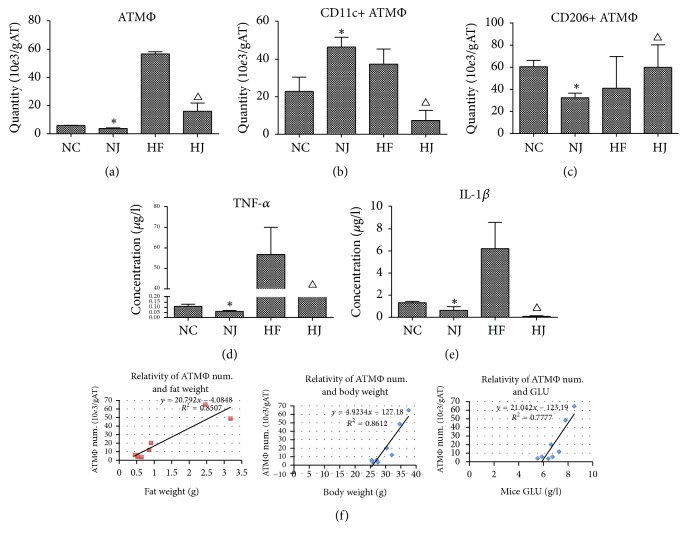
Figure 3.
Adipose tissue macrophages (ATM) in mice (from epididymal fat). (a) Total ATM, (b) CD11c+ ATM and (c) CD206+ ATM numbers, and (d) TNF-α and (e) IL-1β levels in ATM. (f) Positive correlation between ATM and fat mass, body weight, and fasting blood glucose levels in HFD mice. Studies were performed at 16 weeks of age. Values are presented as mean ± SEM (n = 8–10/group). ∗P < 0.05 versus the NC group; ΔP < 0.05 versus the HF group.

