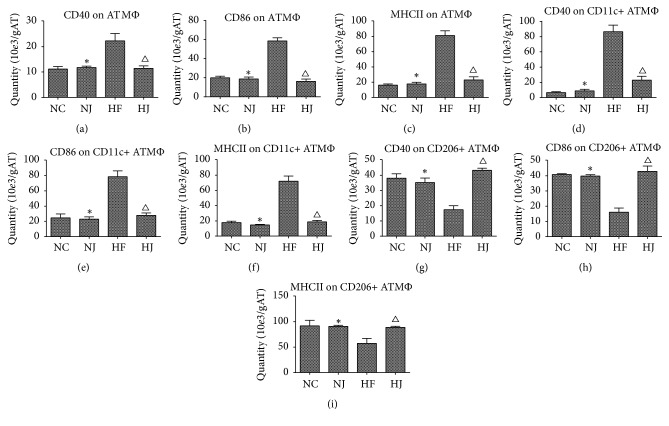
Figure 6.
MHCII among ATM in mice (from epididymal fat). (a) The total number of CD40 on ATM. (b) The total number of CD86 on ATM. (c) The total number of MHCII on ATM. (d) The total number of CD40 on CD11c+ ATM. (e) The total number of CD86 on CD11c+ ATM. (f) The total number of CD40 on CD11c+ ATM. (g) The total number of CD40 on CD206+ ATM. (h) The total number of CD86 on CD206+ ATM. (i) The total number of MHCII on CD206+ ATM. Values are presented as mean ± SEM (n = 8–10/group). ∗P < 0.05 versus the NC group; ΔP < 0.05 versus the HF group.

