. 2017 Dec 1;9(5):1184–1190. doi: 10.1039/c7sc04725h

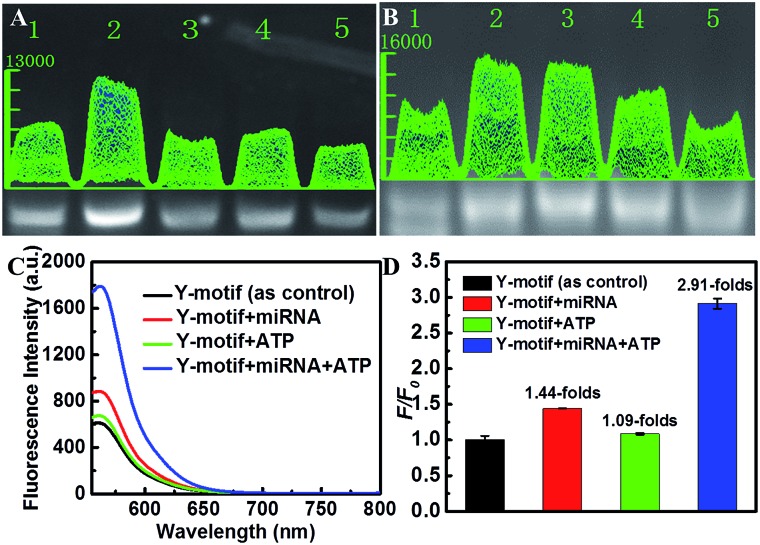
Fig. 2. (A) Agarose gel electrophoresis presenting the influence of the amount of the Yc DNA strand on the Y-motif DNA structure (lanes 1–5, the ratios of Ya to Yc are 1 : 1, 1 : 2, 1 : 3, 1 : 4 and 1 : 5). (B) Agarose gel electrophoresis showing the influence of the amount of the Yb DNA strand on the Y-motif DNA structure (lanes 1–5, the concentrations of Yb are 5, 10, 20, 30 and 40 nM, respectively). (C) Fluorescence response of the Y-motif DNA structure solution containing miRNA-21, ATP and miRNA/ATP. (D) The ratio of fluorescence intensity between the experiment groups (F, in the presence of miRNA-21, ATP and miRNA-21/ATP, respectively) and the control group (F0).

Fig. 2