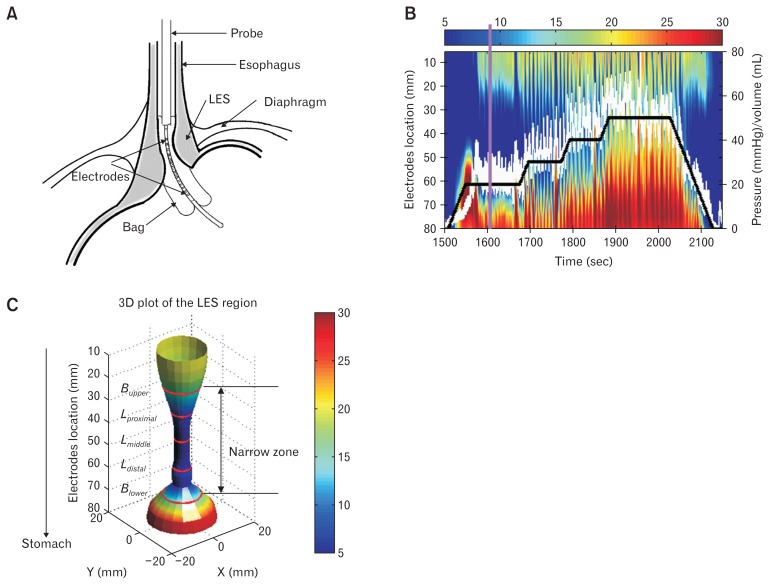
Figure 1.
Functional luminal imaging probe (FLIP) assessment of the esophago-gastric junction. (A) Schematic diagram of the esophago-gastric junction and the location of the FLIP during the test. (B) Example of spatial-temporal diameter map during the stepwise distension protocol. The map color from blue to red represents the diameter increase. The white line is the pressure change during the distension and the heavy black line is the volume change in the FLIP bag. The purple vertical line indicates the FLIP recording at time = 1610 seconds. (C) The 3D FLIP configuration at time 1610 seconds, ie, the purple line at (B), the map color from blue to red represents the diameter increase. The 5 red circle lines are the upper edge (Bupper), proximal (Lproximal), middle (Lmiddle), distal (Ldistal) and lower edge (Blower) locations of lower esophageal sphincter (LES) narrow zone at the time point.

