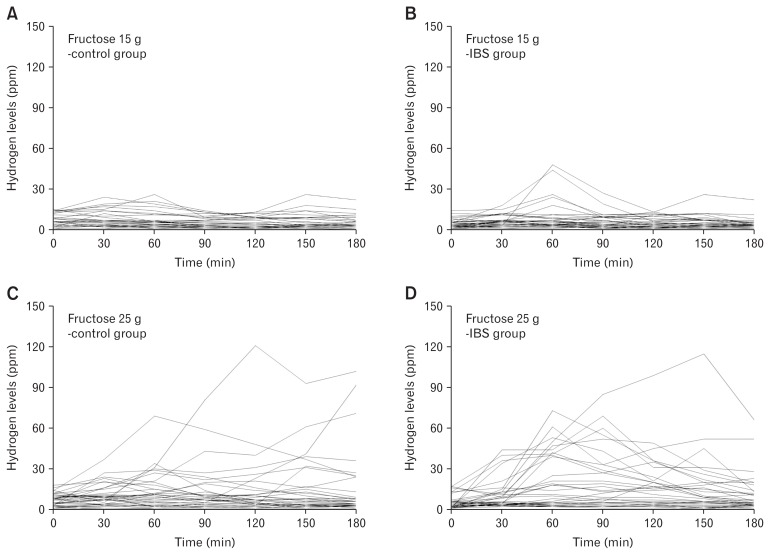
Figure 2.
Hydrogen concentrations, expressed as parts per million (ppm), in the expired air of individuals following the ingestion of different fructose loads dissolved in 250 mL water. (A) 15 g of fructose ingested by the asymptomatic control group. (B) 15 g of fructose ingested by the group of patients with irritable bowel syndrome (IBS). (C) 25 g of fructose ingested by the asymptomatic control group. (D) 25 g of fructose ingested by the group of patients with IBS.

