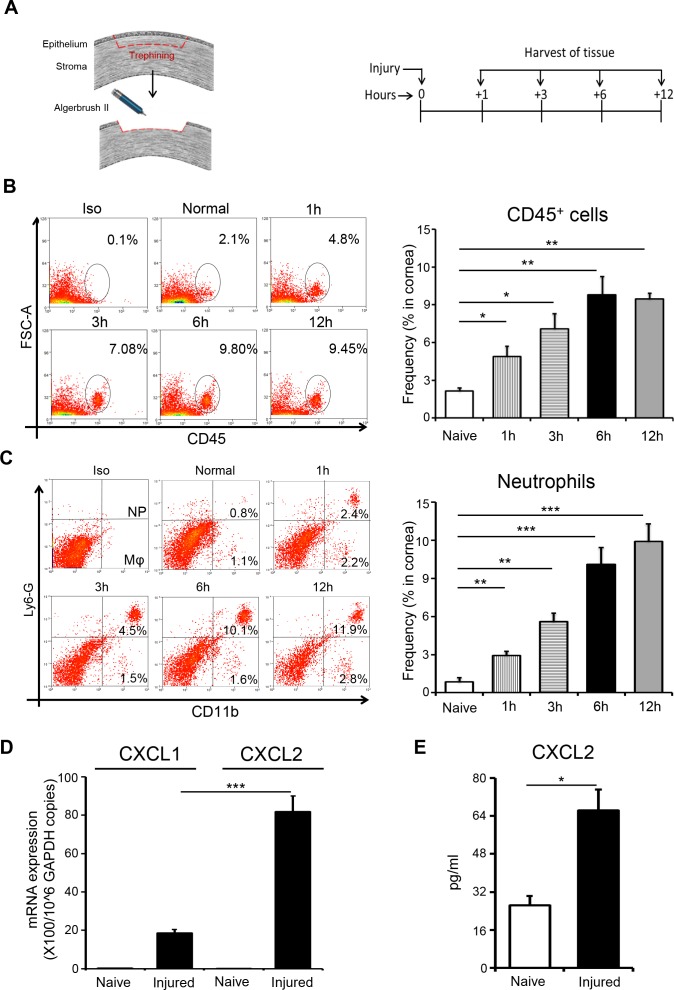
Figure 1.
Corneal injury results in early recruitment of neutrophil to the ocular surface. (A) Schematic diagram depicting the mouse model of corneal injury used (left) and the time points at which tissues were harvested (right). (B) Representative flow cytometric dot plots (left) and cumulative bar chart (right) showing the frequencies of CD45+ inflammatory cells in the cornea at different time points after injury, relative to naïve mice. (C) Representative flow cytometric dot plots showing gating strategy for selecting CD11b+Ly6G+ neutrophils and CD11b+LyG- macrophages in the cornea. Bar chart summarizes the frequencies of neutrophils in the cornea at different time points after injury, relative to naïve mice. (D) Bar chart depicting CXCL1 and CXCL2 mRNA expression at the ocular surface (normalized to GAPDH) in naïve and injured mice at 6 hours after injury, as quantified by real-time PCR. (E) Bar chart depicting CXCL2 protein expression at the ocular surface in naïve and injured mice at 6 hours after injury, as quantified by ELISA. Representative data from three independent experiments are shown and each experiment consisted of five animals. Data are represented as mean ± SD. *P < 0.05; **P < 0.01; ***P < 0.001.

