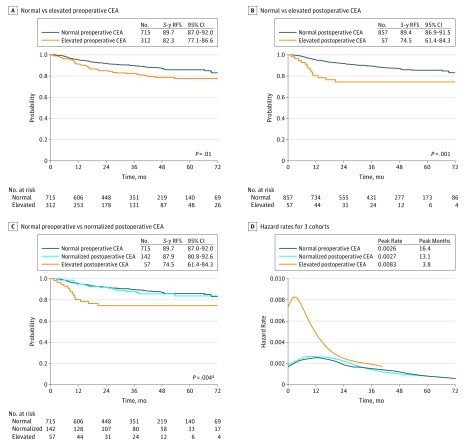
Figure 2. Recurrence-Free Survival by Preoperative and Postoperative CEA Levels.
A, Patients with normal vs elevated preoperative CEA. B, Patients with normal vs elevated postoperative CEA. C, Patients with normal preoperative, normalized postoperative, or elevated postoperative CEA. D, Hazard functions for disease recurrence in the 3 patient cohorts. Figure 2A includes all 1027 patients. Figure 2B and 2C include 914 patients and exclude 113 patients with elevated preoperative CEA and no postoperative CEA. CEA indicates carcinoembryonic antigen; RFS, recurrence-free survival.
a Normal preoperative CEA vs elevated postoperative CEA, P = .001; normalized postoperative CEA vs elevated postoperative CEA, P = .018.

