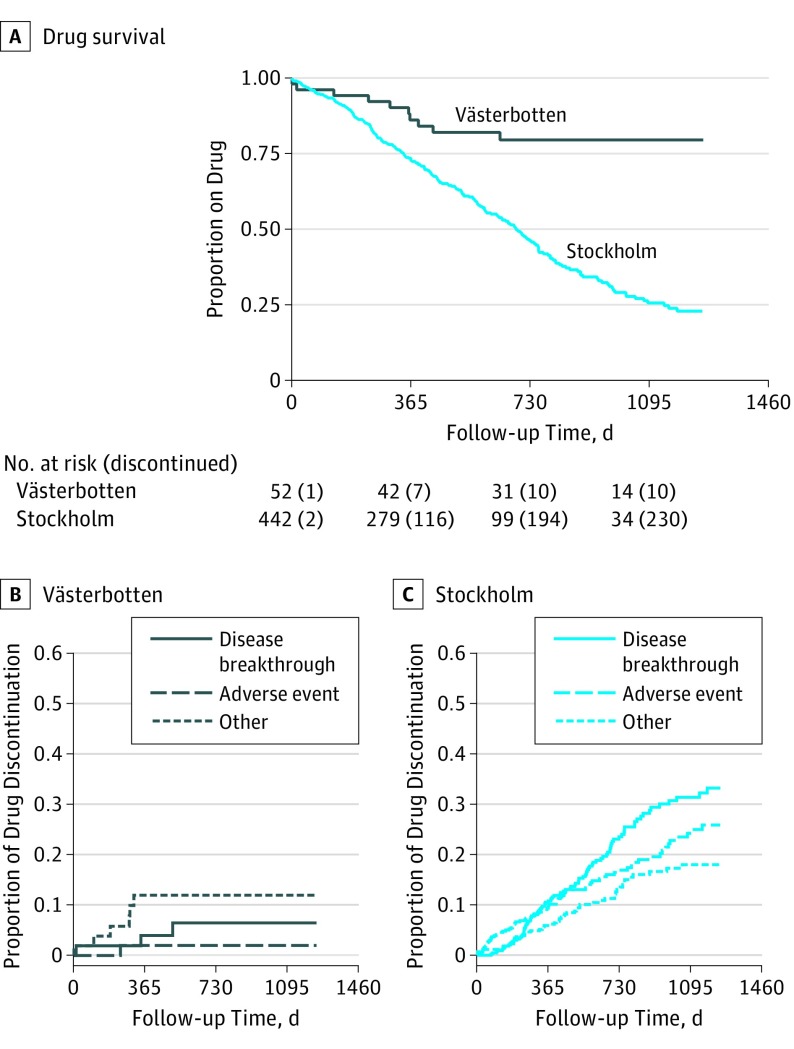
Figure 3. Drug Survival and Reasons for Therapy Discontinuation for Stockholm and Västerbotten Counties.
Plots depicting the different outcomes for the cohorts in Stockholm and Västerbotten Counties: (A) Kaplan-Meier curve for drug survival, cumulative incidence curves of reasons for therapy discontinuation in Västerbotten (B) and Stockholm Counties (C).

