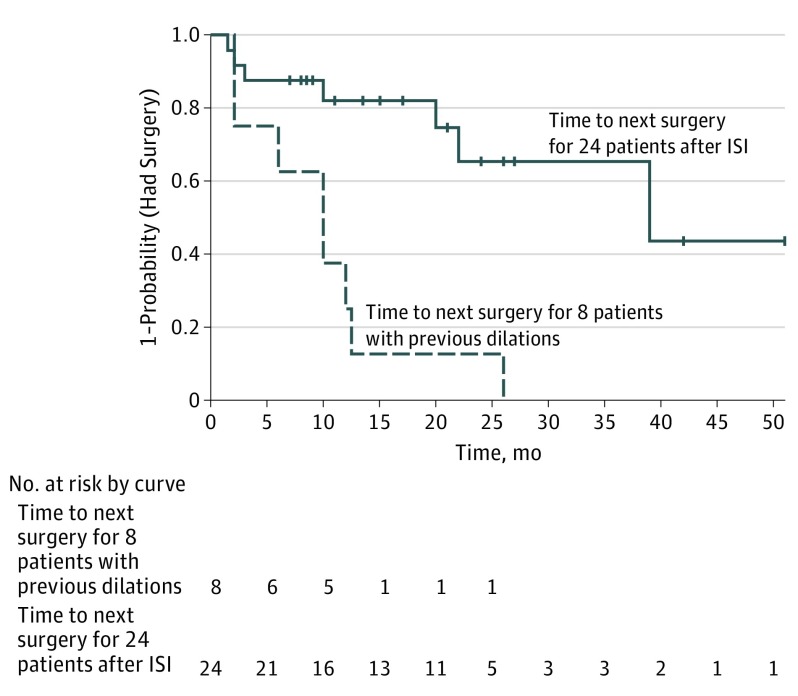
Figure 3. Kaplan-Meier Curve Showing Time to Surgery Pre-ISI and Post-ISI Series.
The dashed line indicates time to next surgery for 8 patients with previous dilations and sufficient follow-up time for comparison of SFI pre-ISI and post-ISI series. The solid line indicates time to next surgery for 24 patients after ISI. Data markers represent censoring at date of last follow-up for patients not undergoing repeat surgery in the follow-up period. ISI indicates intralesional steroid injection; SFI, surgery-free interval.

