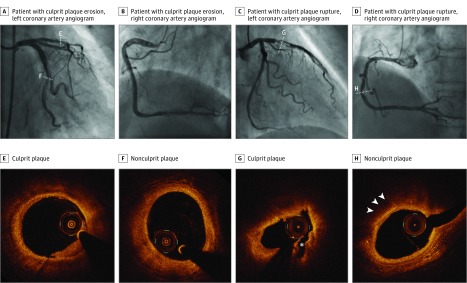
Figure 1. Representative Cases of Culprit Plaque Erosion and Culprit Plaque Rupture.
A and B, Angiogram of a patient with culprit plaque erosion. C and D, Angiogram of a patient with culprit plaque rupture. E, Culprit plaque shows attachment of white thrombus overlying an intact plaque. F, Nonculprit plaque shows a fibrous plaque. G, Culprit plaque shows fibrous cap discontinuity with cavity formation (asterisk). H, Nonculprit plaque shows a lipid-rich plaque with macrophage accumulation (arrowheads).

