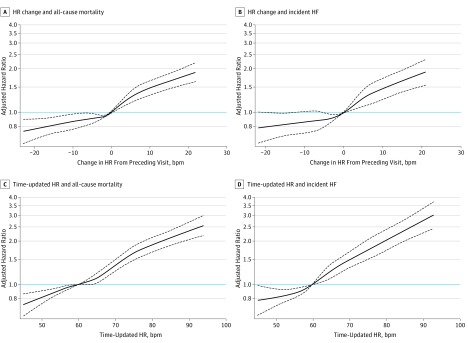
Figure 3. Association Between Changes in Heart Rate (HR) From Preceding Visit and End Points.
The adjusted cubic spline model demonstrates the flexible association between changes in HR from the preceding visit and the hazard of all-cause mortality (A) and hazard of incident HF (B), when no change in HR is taken as the reference (ie, 0 bpm). Both curves display a near linear relationship between change in HR and the end points of all-cause mortality and incident heart failure (HF), such that any rise in HR (>1 bpm) from the preceding visit appears to increase the risk significantly. However, any drop in HR from the preceding visit significantly reduced risk of all-cause mortality, and a drop in HR from the preceding visit of more than 12 bpm is associated with a significant reduction in risk of incident HF. The adjusted cubic spline model demonstrates the flexible relationship between time-updated HR (ie, most recent HR value before an event or end of the study) and the hazard of all-cause mortality (C) and hazard of incident HF (D) when a resting HR of 60 bpm is taken as the reference. Time-updated HR between 50 and 60 bpm during follow-up was associated with a lower risk of all-cause mortality and risk of incident HF compared with a HR of 60 bpm. A time-updated HR between 60 and 66 bpm was not associated with an increase in risk of all-cause mortality compared with a HR of 60 bpm; however, the risk of incident HF was greater above a HR of 60 bpm compared with a HR of 60 bpm. The most recent resting HR above 66 bpm during follow-up was associated with a higher risk of all-cause mortality. The dashed black curves represent the upper and lower 95% confidence limits. The horizontal blue line represents the hazard ratio of 1. The domain was defined by excluding the smallest 1% and the largest 1% of values of change in HR values.

