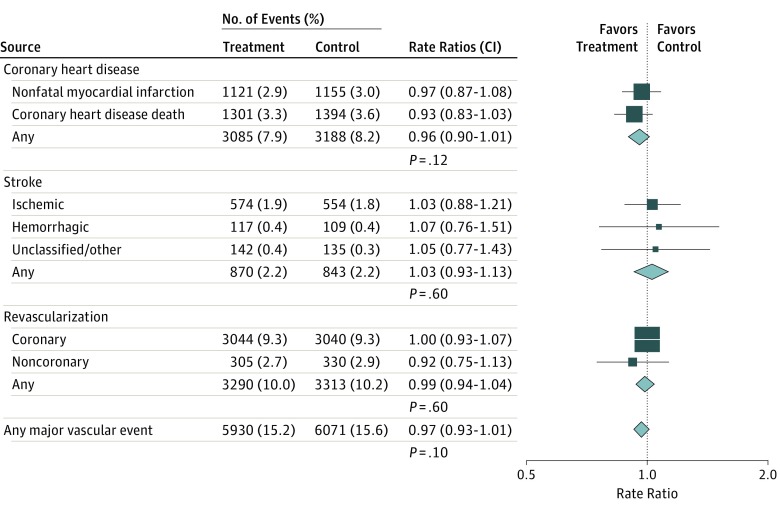
Figure 1. Associations of Omega-3 Fatty Acids With Major Vascular Events.
The number of events by allocated treatment are presented for individual trials and subgroups of trials; participants can contribute only once to subtotals and totals of major vascular events. Rate ratios for individual trials or subgroups of trials are indicated by squares and 99% CIs by horizontal lines. Overall totals and their 95% confidence intervals are represented by diamonds. The size of the squares and the diamonds are proportional to the statistical information conveyed.

