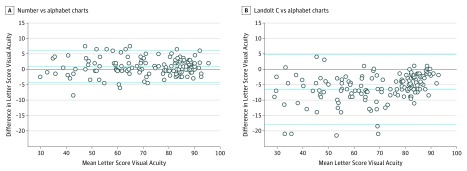
Figure. Difference in Letter Score Acuity Comparing Number vs Alphabet Charts and Landolt C vs Alphabet Charts.
A, Bland-Altman plot showing the mean letter score difference between the number and alphabet charts. B, Bland-Altman plot showing the mean letter score difference between the Landolt C and alphabet charts. The mean difference between the number and alphabet charts is smaller than the mean difference between the Landolt C and alphabet charts. The middle horizontal dashed line represents the mean letter score difference, while the dashed lines at the top and the bottom represent the 95% CI.

