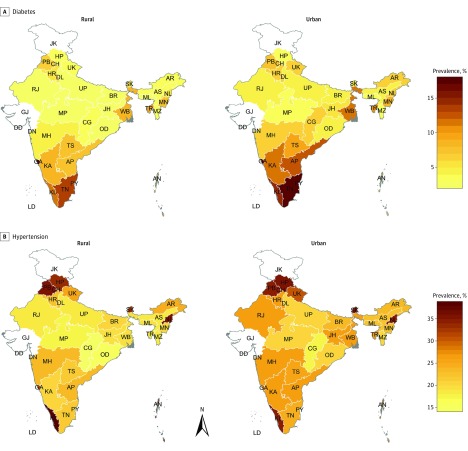
Figure 3. Age-Standardized, State-Level Prevalence of Diabetes and Hypertension by Rural vs Urban Location Within Each State.
A, Diabetes prevalence. B, Hypertension prevalence. No data were available for Jammu and Kashmir, and Gujarat. The Union Territories of Chandigarh, Daman and Diu, and Puducherry are not visible in the map owing to their small area. Point estimates and 95% CIs for each state are shown in eTable 7 in the Supplement. AP indicates Andhra Pradesh; AR, Arunachal Pradesh; AS, Assam; BR, Bihar; CG, Chhattisgarh; CH, Chandigarh; DD, Daman and Diu; DL, Delhi; GA, Goa; HR, Haryana; HP, Himachal Pradesh; JH, Jharkhand; KA, Karnataka; KL, Kerala; MP, Madhya Pradesh; MH, Maharashtra; MN, Manipur; ML, Meghalaya; MZ, Mizoram; NL, Nagaland; OD, Odisha (Orissa); PB, Punjab; PY, Puducherry; RJ, Rajasthan; SK, Sikkim; TN, Tamil Nadu; TS, Telangana State; TR, Tripura; UP, Uttar Pradesh; UK, Uttarakhand (Uttaranchal); WB, West Bengal.

