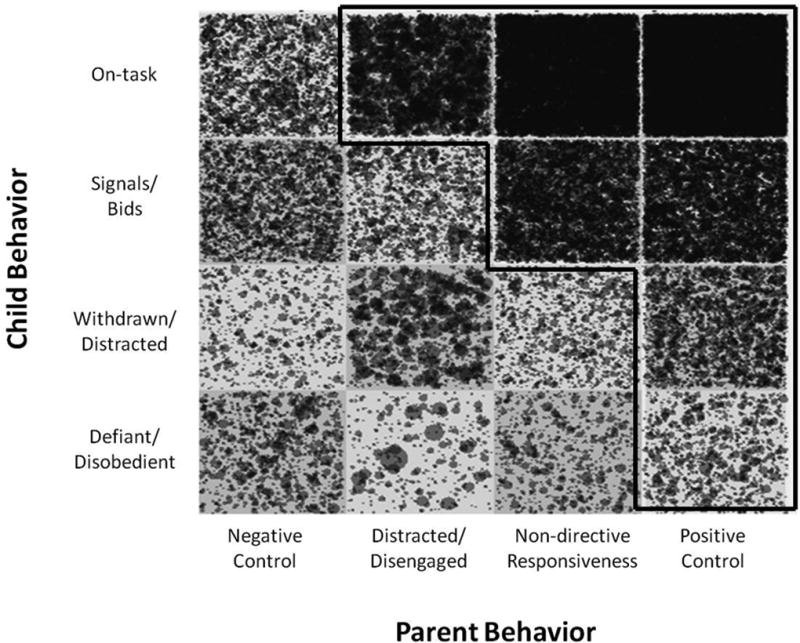
Figure 1.

The State Space Grid with all observed data. Nodes represent each visit (single instance of behavior for a single dyad within a cell), and the size of the nodes represent the relative duration of time for that visit. The Positive Co-regulation region is outlined in bold.
