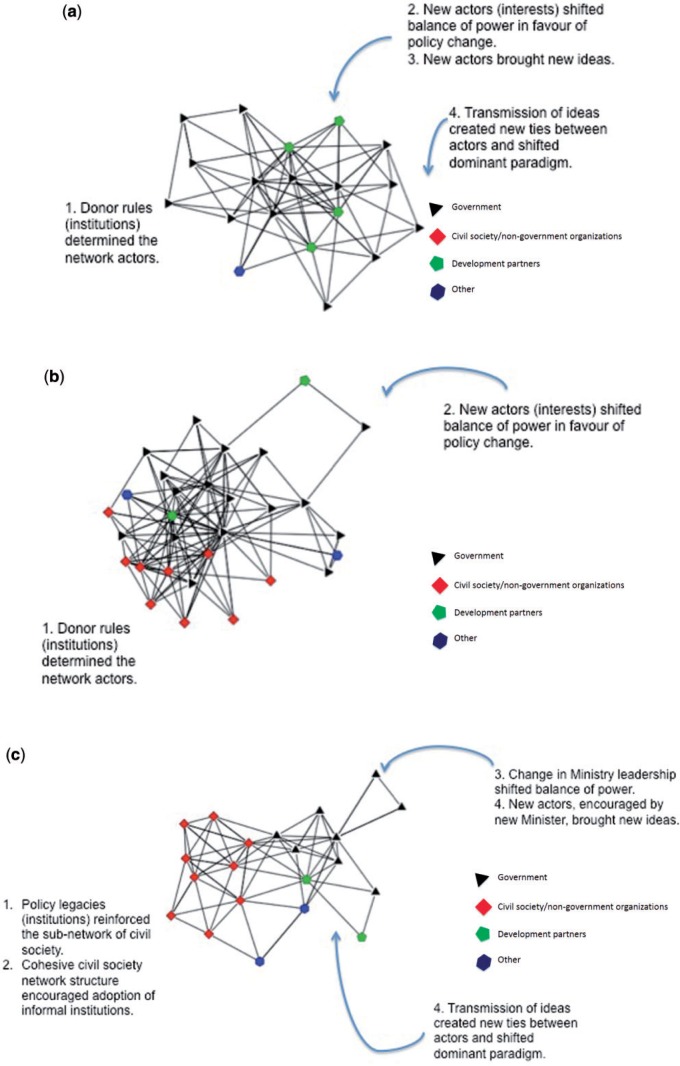
Figure 3.
(a–c) illustrate main findings on network graphs. These graphs represent cross-sections of each network (measured empirically during a linked sub-study; Shearer 2014. These figures are meant to be illustrative; locations of each finding, for example, are not related to specific nodes or relationships in the network.

