
Fig. 2.
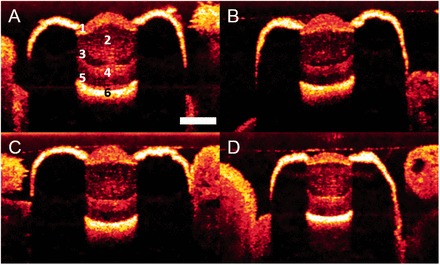
Virtual axial cross-sections of live scallop eyes acquired using OCT. Panel A displays an eye in which labels have been applied to the six scattering bands visible in the majority of our OCT images. Similar scattering bands may be seen in panels B, C, and D. We propose the following interpretation of our OCT images: band 1 represents the cornea, the thin layer of connective tissue between the cornea and lens, and the distal portion of the lens; band 2 represents the remaining area of the lens; band 3 corresponds to the ciliary projections of the distal retina; band 4 represents the cell bodies of the distal and proximal photoreceptors, as well as the glial cells that lie between them; band 5 contains the rhabdoms of the proximal retina and—potentially— a fluid-filled gap between the rhabdoms and the mirror at the back of the eye; band 6 is back-scatter from the mirror. All four panels represent separate eyes imaged under similar conditions. The scale bar in panel A represents 200 µm and applies to all four panels.