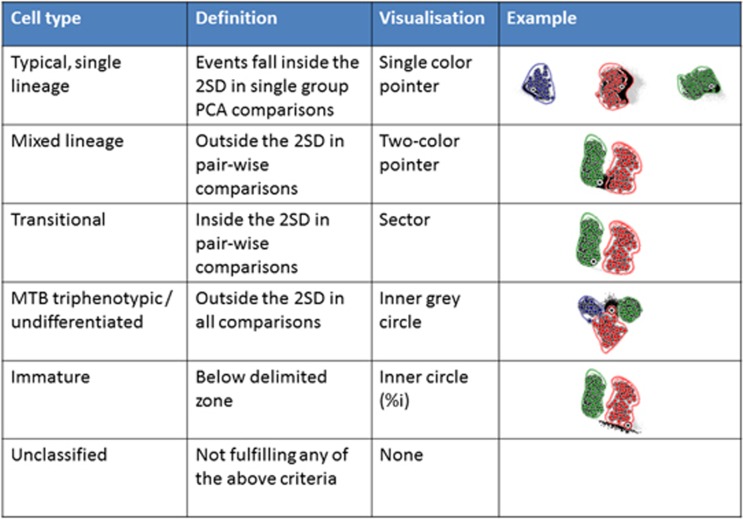
Figure 1.
Schematic overview of the work process of the database-guided classification of leukemic cells from individual patients during the validation phase (Compass tool). The cells are classified as one of the indicated cell types based on the definitions in the second column, in the order as shown from top to bottom. Examples are shown in the right column, in which the three reference groups are represented in blue (T-ALL), green (BCP-ALL) and red (AML) (circles represent the mean of individual patients, the lines represent the 2 s.d. curves of the group), and the cells from the case to be classified are represented by the individual gray and black events. The black events indicate the events that fulfill the definition in the second column. Once a cell has been classified, it is removed from the subsequent steps. The different cell types are visualized in a final Compass, in which each cell type is represented in a specific manner (third column, see examples in Supplementary Information).

