Figure 3.
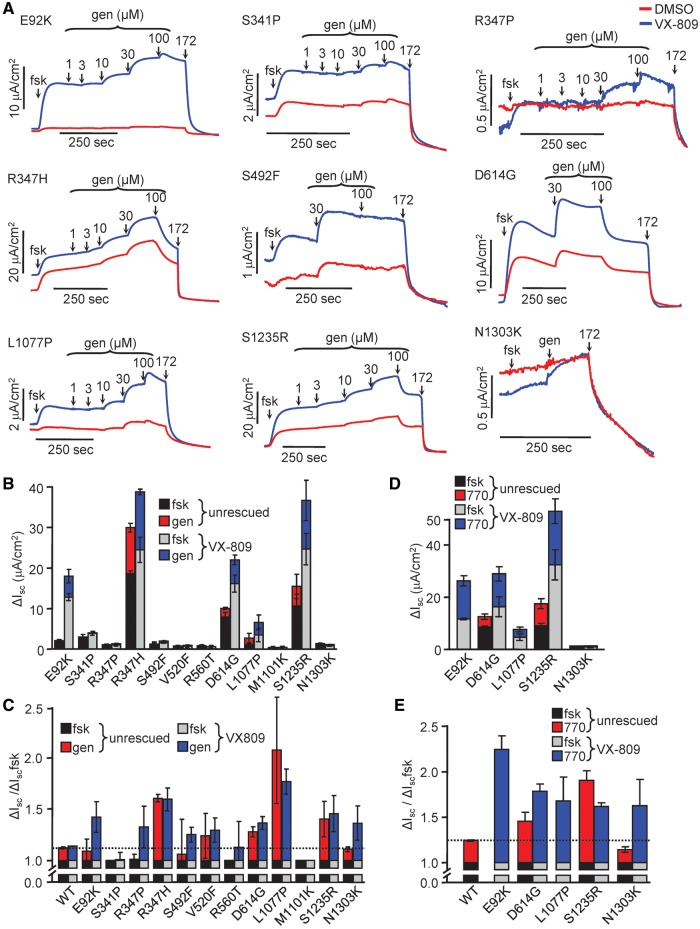
Functional analysis of CFTR2 mutants. (A) Representative Isc traces of CFBE cells expressing the indicated CFTR2 mutants. Cells grown on filter supports were incubated for 24 h with DMSO (red traces) or VX-809 (3 μM, blue traces). Isc of mutant CFTR was stimulated with forskolin (20 μM) and increasing concentrations of genistein until saturation, or a single high concentration of genistein (gen, 100 μM), followed by inhibition of CFTR with CFTRinh-172 (20 μM). Measurements were performed in the presence of a basolateral-to-apical chloride gradient after basolateral permeabilization with amphotericin B (100 μM). (B) Quantification of currents in (A); forskolin was measured relative to initial baseline; genistein was measured relative to fsk plateau. (C) Normalization of data from B showing fold increase of Isc in the presence of forskolin plus genistein relative to that in the presence of forskolin alone. Dotted line is relative genistein response of WT-CFTR. (D) Quantification of CFTR2 Isc potentiated with VX-770 (3 μM). Forskolin was measured relative to initial baseline; VX-770 was measured relative to fsk. (E) Normalization of data from D as described in C to display VX-770 effect relative to forskolin. Dotted line is relative VX-770 response of WT-CFTR. All experiments are n = 3; error bars are SEM.

