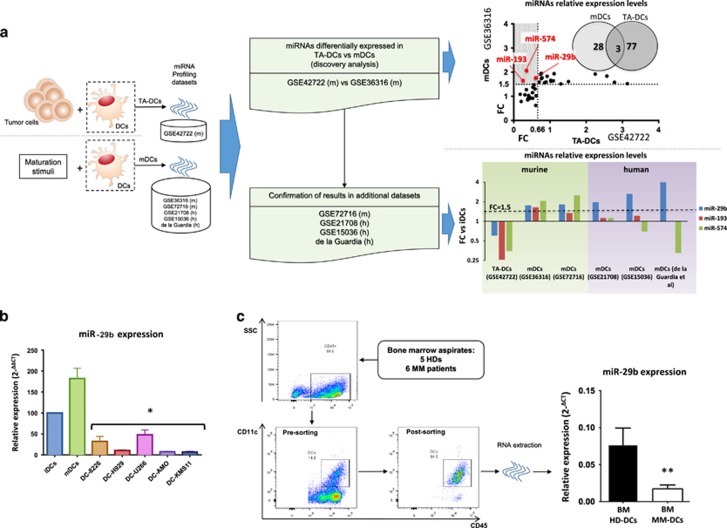
Figure 1.
(a) Workflow to identify miRNAs differentially expressed in TA-DCs as compared with mDCs. We adopted a two-step approach: in the discovery analysis we compared miRNAs differentially expressed in murine mDCs (data set GSE36316) with murine TA-DCs (data set GSE42722). The shadowed portion of the picture (at the end of the first step) evidences that only three miRNAs are upregulated at least 1.5 times in mDCs and downregulated at least 1.5 times (ratio=0.66) in TA-DCs, among the differentially expressed miRNAs. In the second step we confirmed these results in further four data sets. The results regarding the modulation (with their respective fold changes) of the three miRNAs selected in the ‘discovery’ step in all murine and human data sets evaluated are reported. A line representing the 1.5FC cutoff clearly demonstrated miR-29b as the only miRNA upregulated across all mDCs data sets. (b) Relative expression of miR-29b in iDCs, mDCs and DCs co-cultured with five different MM cell lines. All experiments have been repeated at least three times. *P<0.05. (c) A representative dot-plot highlighting the gating strategy used to sort DCs from BM aspirates of HDs (BM HD-DCs) or MM patients (MM HD-DCs) and the relative expression of miR-29b in these cells. **P<0.01.

