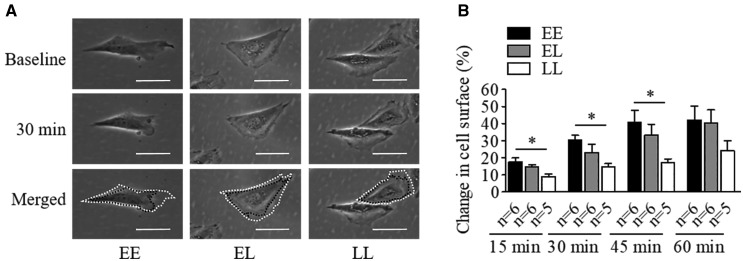
Figure 7.
The BP-elevating allele at NPR3 locus enhances Ang II-induced human VSMCs contraction. ‘E’ indicates the BP-elevating allele, ‘L’ denotes the BP-lowering allele. (A) Representative images of VSMCs of the three different genotypes at baseline (before stimulation) and 30 min after treatment with 100 nmol/l Ang II, respectively. White dash lines show the original size of cells at baseline, and the black ones outline the sizes at 30 min in the merged panel. Scale bars = 50 µm. (B) Differences in 100 nmol/l Ang II stimulated VSMC contraction of different genotypes at 15, 30, 45, 60 min. Mean ± SEM, *P < 0.05.

