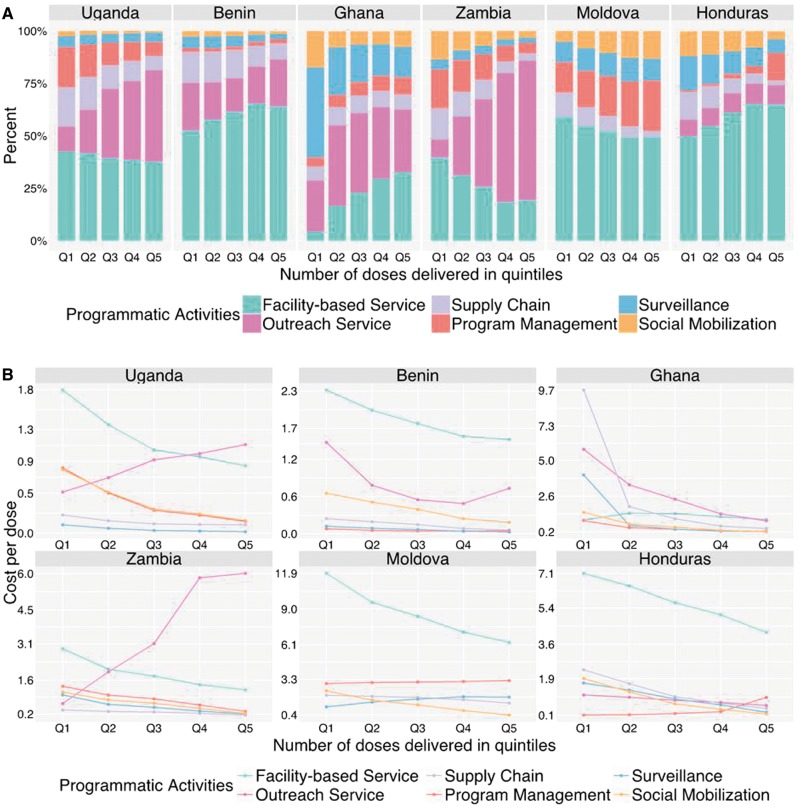
Figure 4.
Changes in site-level cost shares (Panel A) and cost per dose (Panel B), across programmatic activity categories related to increasing services delivery volume. Bars within each country are displayed as increasing number of doses delivered, discretized by quintile. Percentages represent the weighted mean cost share of all facilities in each country

