
Figure 1.
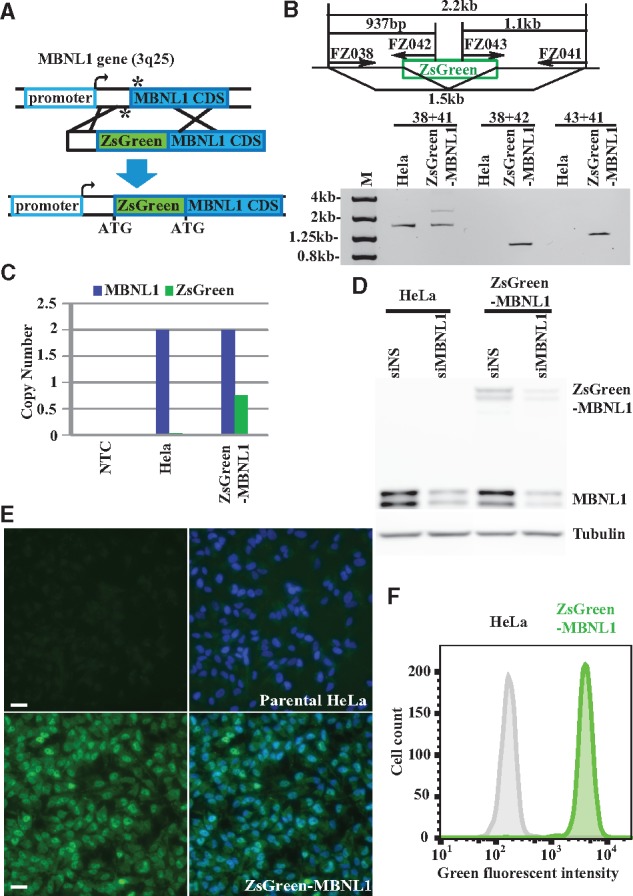
Site-specific integration of ZsGreen into endogenous MBNL1 locus generates ZsGreen-MBNL1 cells expressing green fluorescent fusion protein. (A) Schematic diagram of the strategy to insert a ZsGreen cassette into the MBNL1 locus (not to scale). The asterisks indicate the position of the single-strand breaks generated by Cas9 nickase/sgRNAs. The middle diagram shows the donor vector that contains the left and right homologous MBNL1 arms and the ZsGreen reporter. (B) ZsGreen integration in MBNL1 locus is confirmed by PCR followed by agarose gel analysis. Primer sets and PCR products are indicated in the upper diagram. (C) Droplet digital PCR (ddPCR) quantifying MBNL1 and ZsGreen copy number in no-template control (NTC), parental HeLa and ZsGreen-MBNL1 genomic DNA and plotted on the bar graph. (D) Immunoblotting shows MBNL1 and ZsGreen-MBNL1 protein expression in parental HeLa and ZsGreen-MBNL1 cells. MBNL1-silencing siRNA (siMBNL1) and non-silencing siRNA (siNS) control were used to demonstrate MBNL1 antibody specificity. Tubulin was used as a loading control. (E) Fluorescent microscopy images of parental HeLa and clonal ZsGreen-MBNL1 #27 using the same exposure. The green fluorescent images are on the left; the merged images of green and blue (DAPI staining) signal are on the right. Scale bar is 20 µm. (F) Flow cytometry quantification of green fluorescent signal in parental HeLa cells and ZsGreen-MBNL1 clone #27.